
Introduction
In the past year and a half, the outbreak of the contagious disease COVID-19 brought dramatic transitions to the planet. The history of COVID-19 could be traced back to December 2019, when multiple unexplained pneumonia cases caught the public’s awareness in Wuhan, Hubei. In the following months, the virus rapidly spread from Hubei province to the entire nation and then the whole world. Crowd panics and medical supply shortages could describe the early impression of the outbreak. After realizing the severity of the situation, the Chinese government decisively formulated a series of policies to prevent the pandemic from further enlargement.
One particular policy that has been intensely discussed is the “city lockdown,” even though it has been proved crucial in the repression of the virus afterward. However, its critics believe that it had done further severe damages to the economy. Which already has been significantly harmed by the virus itself.
In this general background, people are being forced to stay at home, and as a result, family conflicts were magnified, the whole society was terrified, and people’s psychological stress increased. Thus, to relieve stress, people spent much more time staring at their screens and playing video games, which might have caused vigorous growth in the game industry.
A recent study suggests that people over 20 years old have increased their video game time by over 50 percent (Colley, 2020). A longer game time led to a higher pursuit for video games, whether buying new games on game platforms or purchasing in-game items. Eventually, the time people spend playing video games would affect the profitability of game corporates, which could be measured using their stock prices.
Similarly, stock prices have been proven efficient in reflecting on human behaviors in other researches. For example, an economics study focused on the influence of business events and social media messages on the prices of certain stocks indicates a positive correlation between them (Strauß, 2018).
In order to determine the impact of stress coming from COVID-19 on Chinese people’s lives, I use the stock prices of Chinese game companies to represent people’s relaxation time. So that by analyzing and evaluating specific stock prices, I would be able to determine how COVID-19 affected Chinese people’s overall stress. Moreover, I chose three indicators to specify the rigorousness of the epidemic in China: accumulated local cases, new local causes, and new deaths. Nevertheless, the impact of the pandemic on people could not be fully estimated, so in addition to a model, I will also explore its impact through empirical studies.
In this passage, a multiple regression model and two-way fixed effects are applied to develop sophisticated and comprehensive research on the impact of COVID-19 on people’s stress in China. By evaluating stock prices before and during COVID-19.
Data
The COVID-19 data in this paper are obtained from the daily updated pandemic dailies of the Chinese government, spanning from the early stage of the epidemic to the current normalization stage of the epidemic (2020.1-2021.6). I collected the cumulative number of confirmed cases, new deaths, new local confirmed cases, and daily cures.
The data on gaming companies are extracted from 58 listed Chinese gaming companies manually from Choice Finance terminal, including Tencent, Giant Network, NetEase, etc. Covering Hong Kong, the US, Shanghai, and Shenzhen stocks. The data contains the closing prices of stocks every Friday since 2018 (2021.6), including financial information such as company assets, liabilities, and more.
By using the single-to-multiple matching method, I managed to get a total of 3564 variables regarding the pandemic and the stock data.
Baseline(Simple Regression Model)
Defining $Y$ as the stock price for a firm $i$ on date $t$, which could be expressed as follows:
$$Y_{it}=\alpha_0+\beta_{1}X_t+\epsilon_{it}\tag{1}$$
$Y_{it}$ stands for the stock price of firm $i$ on date $t$, while $X_t$ represents the magnitude of the COVID-19 indicators (local increase/new death/local accumulated cases) in China. Additionally, $\alpha_0$ is a constant value, and $\epsilon_{it}$ is a term for random interferences and errors that affect the value of $Y$ but are not concerned in this model. $\beta_1$ represents the change amount of $Y_{it}$ when one unit of $X_t$ is added, and it could directly reflect on the relevance between COVID-19 indicators and stock prices.
However, there are many drawbacks to this model. For instance, stock prices are influenced by the epidemic and many other factors such as corporate financial indicators and market business cycles. So, for the next step, I decided to take observable data of firms into account by changing my simple regression model to a multiple regression model.
Multiple Regression Model
I added the symbol $\sum_{n}^{}\lambda_{m}Z_{it}^{‘}$ to formula (1) to represent the sum of all observable data regarding the firm to make the model more comprehensive.
$$Y_{it}=\alpha_0+\beta_{1}X_t+\mu_i+\mu_t+\sum_{n}^{}\lambda_{m}Z_{it}^{‘}+\epsilon_{it}\tag{3}$$
The symbol $\sum_{n}^{}\lambda_{m}Z_{it}^{‘}$ indicates the sum of all observable data regarding the firm. Hence the model is becoming more comprehensive.
Nevertheless, there is the question about market business cycles and corporate characteristics that are both unobservable and time-invariant. Although they have nothing to do with the firm itself, they control its information, so it is necessary to include them in the model.
Notably, I managed to place the two-way fixed effects into a multiple regression model to create a more accurate reflection of the reality, which is quite innovative.
Multiple Regression Model with Two-Way Fixed Effects
For the final version of this model, I added the firm fixed effect $\mu_i$, and time fixed effect $\mu_t$ to describe other factors that influence stock prices but are not measurable.
$$Y_{it}=\alpha_0+\beta_{1}X_t+\sum_{n}^{}\lambda_{m}Z_{it}^{‘}+\epsilon_{it}\tag{2}$$
Before testing the model, I exponentiated the COVID-19 indicator $X_t$ to $ln(X_t)$ to measure the change of $Y_{it}$ by the rate of change of $X_t$. Since there used to be hundreds of confirmed local COVID-19 cases when the pandemic was severe, calculating the rate of change is more reasonable and makes more sense in economic terms than just studying the change in quantity. Moreover, by using $ln(X_t)$, I can reduce absolute differences between data and avoid the impact of outliers. Its principle is shown in the following formula:
$$\Delta Y_{it} = \beta_1\Delta ln(X_t)\tag{4}$$
And formula (3) could be written in this form:
$$Y_{it}=\alpha_0+\beta_{1}ln(X_t)+\mu_i+\mu_t+\sum_{n}^{}\lambda_{m}Z_{it}^{‘}+\epsilon_{it}\tag{5}$$
As for $Y_{it}$, considering that stock prices vary by firm, adding all the stock prices together is pointless and calculating its change. So, I decided to set the average stock price of firms starting from 20 weeks before the outbreak of COVID-19 (which is January 17th, 2020) to the outbreak of COVID-19 as the primary values and let them be divided by the stock prices of the corresponding firms during the pandemic. So that I can get the average percentage of the growth of all firms during the pandemic instead of their actual growth, and then I would be able to analyze and evaluate the impact COVID-19 brought on game companies.
On behalf of verifying the degree of influence COVID-19 had on stock prices, I will regress all three COVID-19 indicators together to identify which indicator has the most decisive impact. So $\beta_1$ could be expressed as:
$$\beta_1=\beta_2+\beta_3+\beta_4\tag{6}$$
The $P$-value is an indicator for the robustness of the metric results. It indicates the probability of getting even more extreme results than the observed results, assuming that the hypothesis is true. So the smaller $P$ is, the more likely that the hypothesis is correct.
Empirical Results
A Redline was added to the graphs after I closely examined the $\beta$ value I obtained as a result, and found that after around June $20^{th}$, 2020, the $\beta$ value seems to be inconsistent with the $\beta$ value till this point. After more researches and literature review, I found that the normalization of the COVID-19 caused this phenomenon. People were adapting to the pandemic and probably developing a much more regular schedule with a lesser amount of relaxing time and, of course, game time (Ilan, 2020). Subsequently, the profitability of game companies decreased, so were the stock prices.
So, to make the result practical, I will only discuss and analyze the section of data before the red line throughout the following paper.
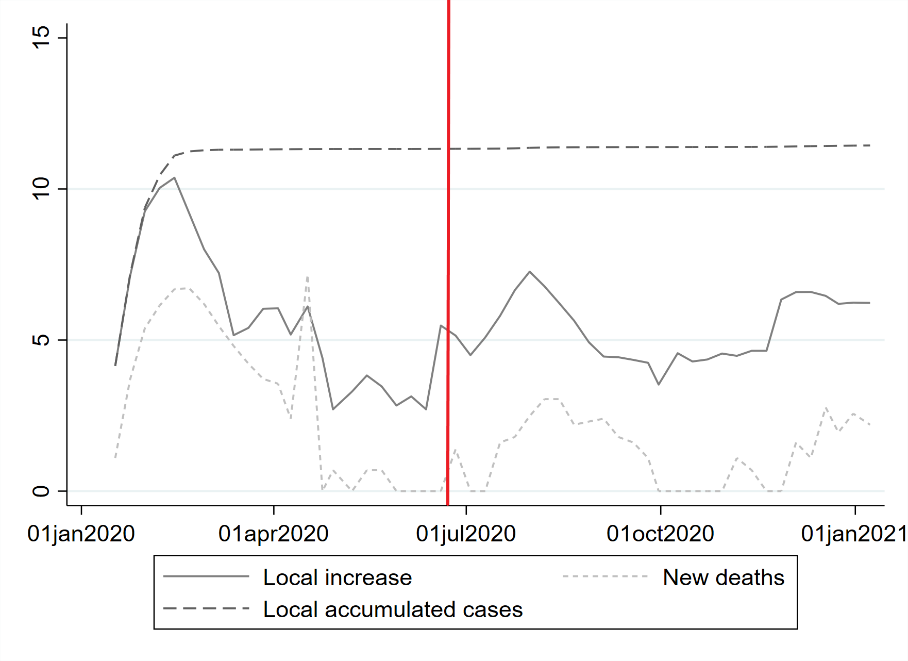
Figure 1 illustrates the epidemic’s severity between January $1^{th}$ 2020 and July $1^{th}$ 2020 by using different COVID-19 indicators: local accumulated cases, local increase cases, and new deaths (in their logarithm form, as mentioned in the previous section).
The light-grey dash line describes the fluctuation of new deaths, and the solid grey line presents the increase in cases every day. The indicators have similar fluctuation patterns, both increasing rapidly right after the outbreak of COVID-19 in January, that was when the cardinal number was still relevantly small, so the virus is growing exponentially. And then, the lines make a downward turn, which may be caused by government policies to control the spread of COVID-19. In May 2020, the epidemic showed signs of recurrence, and you can see a short bulge in the graph. Moreover, the cumulated cases of the coronavirus, represented by the dark-grey dashed line, show corresponding traits compared to the other two indicators but stayed relatively constant since its base number had already grown massively, its shifting at a trivial scale.
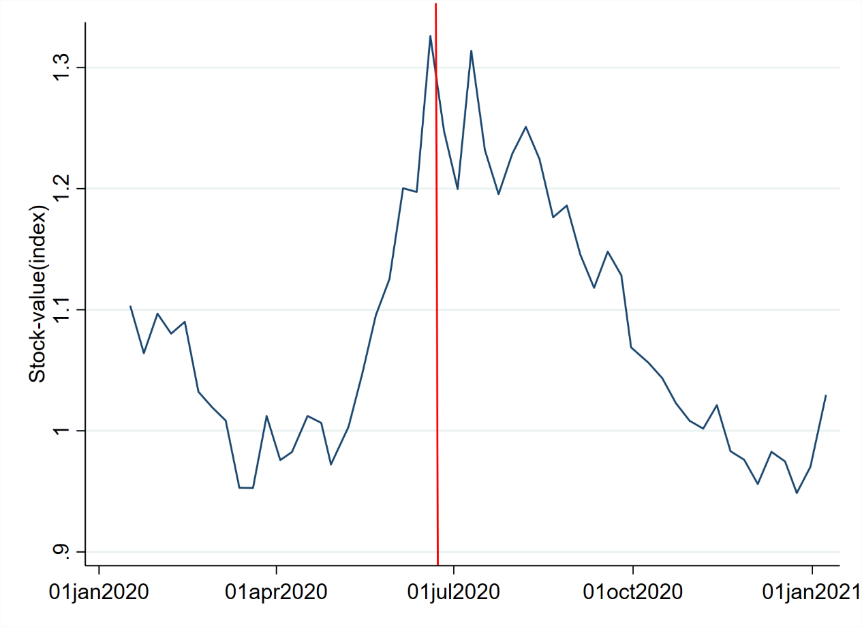
Figure two shows the variation of the average stock price of the 58 firms during January 2020 to July 2020 time period. It first shifts down as the consequence of the pandemic outbreak, just like any other stocks, but then bounces up, which is consistent with the hypothesis I held that people had to spend more time playing video games to relieve their stress.
After completing the model, I apply the OLS (ordinary least squares) to perform regression analysis on the model to calculate the coefficient of the COVID-19 indicator ($\beta$) and the $P$-value.
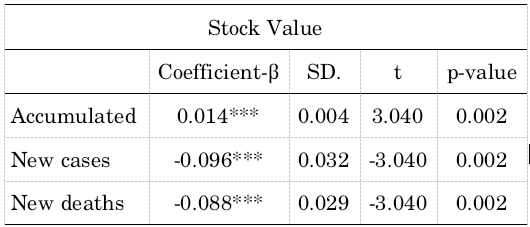
The first row of the above chart shows that the $\beta$ of accumulated cases is 0.014. When accumulated cases increase by 1%, the stock price increases by 1.4%, consistent with my initial assumption. Moreover, the $P$-value, 0.002 imply that there is only 0.2% that the $\beta$ is inaccurate. It is worth noting that in the second and third row, the $\beta$ is negative. This means that as the two indicators increases, the stock price decreases.
Now, this could draw to the conclusion that my initial assumption about the relationship between stock prices and the severity of the COVID-19 is false and that all the efforts I made up to this point are meaningless. However, as I look for explanations of this surprising result, I found a study that reveals the possible answer: by quantifying people’s fear for the coronavirus, it is possible to forecast stock prices (Lyócsa, 2020). Furthermore, it rings a bell for me. Could the daily reports of newly diagnosed cases and deaths caused fear among people and caused the stock price to drop? It can also explain why accumulated cases are different: it is long-term data and could not reflect people’s emotional change according to the epidemic’s severity. Furthermore, from the low $P$-values in the chart, I can conclude that these results are accurate.
Although different results are obtained from the three indicators, there are still apparent relationships between the three indicators. For example, local case increases would affect accumulated cases and new deaths as well. They are not independent of each other. Moreover, by making an overall regression of the three indicators, I can directly compare the significance of every indicator’s impact.
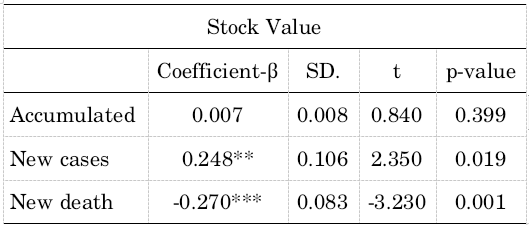
In chart two, while it is still relatively small for the other indicators, the $P$-value of accumulated cases became significantly larger, meaning that its impact on stock price may have vanished, or to say, absorbed by the impact of local increase cases and new deaths since these two indicators have a higher $P$-value. So, the influence on stock price could be decomposed into two factors: the stress effect that local case increases held on people, and the market-fear effect new deaths bring. What is more, their $\beta$ is somewhat similar in terms of absolute value, meaning that the remaining indicators may have a homogenous impact on the stock price. Ultimately, the stock price of game corporates was a reflection of people’s stress and the fear people have for the pandemic.
Conclusion
In conclusion, this passage analyzed how COVID-19 has influenced Chinese people’s stress. I manually collected stock data regarding serval game firms in China, and by using two-way fixed effects multiple regression model, I integrated and perfected my assumption that COVID-19 brought stress to the society, and to relieve stress, people spent more resources playing video games, thus profiting the game industry and reflecting on its stock prices. Empirical results indicate that people relieve their stress by making consumptions in-game products according to the severity of the pandemic. However, another crucial factor that I had overlooked——people’s fear of the epidemic, decreased the price of all stocks in general. This is an essential finding in understanding the impact of the COVID-19 on Chinese people’s lives and stress.
References
- Arkenberg, C. (2020). Will gaming keep growing when the lockdowns end? Deloitte Insights.
- Chambers, R. (2021). Play Apart Together.
- Coibion, O., Gorodnichenko, Y., & Weber, M. (2020, May 11). The cost of the covid-19 crisis: Lockdowns, macroeconomic expectations, and consumer spending. NBER.
- Colley, R., Bushnik, T., & Langlois, K. (2020). Exercise and screen time during the COVID-19 pandemic. Research Gate.
- Ilhan, B., Bayrakdar, ibrahim, & Orhan, K. (2020, June 29). Dental radiographic procedures During COVID-19 outbreak and NORMALIZATION period: Recommendations on infection control. Oral Radiology.
- Lyócsa, Š., Baumöhl, E., Výrost, T., & Molnár, P. (2020, August 26). Fear of the coronavirus and the stock markets. Finance Research Letters.
- Smith, N. (2020, May 14th). The giants of the video game industry have thrived in the pandemic. Can the success continue? The Washington Post.
- Strauß, N. (2019). Using an interdisciplinary multi-method approach to explain the relationships between news media and the stock market.
- Vyas, N. (2020, June 4th). COVID-19 and the Games Industry: Opportunities and Challenges. media writes.law.